
powered by

Introduction
BIG* Data Studio is powered by G* studio, an interactive environment for
G*, the Dynamic Graph Database.
It is available as a fully embeddable component or as a
stand-alone application.
Features include
- syntax-highlighting graph editor and console
- visualization tools
- query and analysis tools
- configuration analysis and management
Important Dates
| June, 2016 | Begin on G* Studio / Big Data Studio v2.0 |
| June, 2015 | G* Studio / Big Data Studio v1.0 demos |
| May 5 and 7, 2015 | Teaching Graph Theory with G* |
| April 10, 2015 | Third demo (SQL integration, graph queries, graph evolution) |
| December 11, 2014 | Second successful demo (interactive graph creation and drawing, logging, tutorial) |
| October 20, 2014 | First successful demo (console working, graph retrieval, graph drawing) |
| September 8, 2014 | Kick-off Meeting |
Development
Team Communication
Build Configuration
Deploy Configuration
AWS Code Deploy looks promising. Let's keep an eye on that.
Tools in Use
Tools to consider
- Alan and the G-stars on Slack at g-star.slack.com
Build Configuration
Deploy Configuration
AWS Code Deploy looks promising. Let's keep an eye on that.
Tools in Use
Tools to consider
Questions, Answers, and TODOs
-
Summer 2016
See the issues in our Git Repository for more detailed tracking.- Enhance the visualizer considerably.
- Add more common named graphs.
- The error reporting is inconsistent and sometimes not as detailed as it could be. Fix it.
- Alan wrote a more robust version of .success(function (data, status) inside setCurrentGraph(command). Use that version everywhere you can, but without duplicating the code. (Feel free [encouraged, even] to further improve it as well.)
- Related to the above, there is way too much repeated code in studio around .success and .fail functions. For that matter, there are too many duplicated $.ajax calls. Shouldn't only have one? Refactor to eliminate as much of the duplicated code as possible.
-
Summer 2015
- Continue working on our papers. See the G* Reports Git repository.
- In the SQL editor, let's put the "That command is not supported." error (and any other ones) in the same non-editor-area spot as "x Rows Returned".
- Explore branding/marketing ideas: "Discovery vs Search" and "New Dimensions in Discovery".
-
I'm thinking of a console command like "debug sql" (or "debug gstar") that sets a server-side
flag to return debug data for SQL (or graph (or both)) operations.
This data would be displayed in the text area of the data pane.
For "trace sql", we would first call "explain
" and put those results (as text) in the data pane, then execute the query itself and display the results in the table as usual. For graph commands we'll need to implement something in APIcore and inside G* itself. - Figure out where and how we should display non-editor and non-console errors. (E.g., interactions with the Data panel or the Visualizer panel that go wrong.)
- Let's support many synonyms for "vertex": person, patient, doctor, company. Each synonym would be specified as a certain color vertex when drawn. We'll need the ability to assign colors to vertices in the code. And we'll need an easy way to configure this.
-
Spring 2015 - More than 8,000 lines of code spread over 520 GitHub commits so far.
- Start writing a paper or three. See the G* Reports Git repository.
- We're tracking Slack "todo" items with Data, the Slackbot that Thomas wrote.
- Enhance tutorial to be both the G-star Studio and Big Data Studio tutorial depending on context. Also, update all the features and interactive examples.
- Implement Selector Mode to chose vertices to pulse.
- Implement pulsing vertices so that we can differentiate by color and pulse.
- Highlighted 1, 2, or 3 hops when a vertex is selected.
- Add attributes to vertices
- Draw the worker tree
- (Recenter and) redraw the graph when the Visualizer after the visualizer is expanded or contracted.
- Tighten up the spacing in the drop-downs for graphs, commands, and queries. Meaning, can there be less white space between the lines? The section titles are fine. I'm talking about the actual choices.
- I would like to revisit the expansion of the Visualizer. Can you make it expand to cover the graph editor and graph console?
- Ignore comment lines (-- this is a comment line) when executing editor commands.
- Add clone graph functionality to help and tutorial.
- SQL Editor error handling in general is ugly. Why do some messages come up in the graph console?
- Add the 'get workers' command to the tutorial.
- The top-k query is printing results in the graph console (which is weird, and not what we had so far as I remember) as well as the data area (which is good). Let's fix that.
- Set the delay (there is a delay, right?) on the tool-tip popups to be 1 second. I think the tool-tips are currently instant.
- Set the active graph to whatever graph was just drawn in both Studio and on the server.
- Related to the above, let's also allow for specifying a color on vertex creation. E.g., "new vertex a red". This would need to somehow become an attribute of the vertex so it can be drawn in the appropriate color later on. That probably has a lot of ramifications all across the system.
- Still related to the above (and above), there other callbacks that jQuery supplies, such as .complete and .error. Let's use these too for more robust responses and error reporting.
- Learn more about apple-touch-icon-precomposed.png interactions with APIrest and report back. See here.
- Continually test the GUI, update the help, and enhance the tutorials.
- Make the graph editor act like the SQL editor in terms of executing only the selected lines when lines are selected, or everything otherwise.
- Graph drawing now supports vertex self-loops. (I.e., add edge 14 - 14)
- When the user presses Enter in the Graph Console, navigateLineEnd() is called before processing the Enter. This prevents "broken" lines.
- The 'get workers' command has been added to the help pages.
- Cassie added a drop-down of pre-defined graphs (like Zork) in the top-right of the Graph Editor.
- Cassie added a drop-down of pre-defined queries (like doctors treating patients for symptom) in the top-right of the Database Editor.
- Alan wrote magic for turning properly formatted SELECT results in the Data panel into a collection of create edge from-to commands in the Graph Editor.
- Thomas updated hidden festive mode "documentation"
- The table and textarea inside the Data panel are fixed size and scrollable inside themselves.
- We can modify the graph without re-rendering it. This is very helpful when adding an edge, or for turning certain vertices a different color (to display the result of a query, perhaps).
- Enforce the exclusion of space, dash, and comma vertex names.
- Allow only SELECT commands in the SQL console.
- Liveness (G* server connectivity) badges.
- Distinguish buttons and labels.
- Add SQL console and output panels
- Ints are finessed into doubles to make dealing with graph IDs easier. I.e., "0" = "0.0" .
- One may wonder Why we have both .getJSON and .ajax. Shouldn't we have standardized on one or the other? well, it's because sometimes all we need is getJSON and it's simpler. (We may want to revisit this.)
-
We now accept "new graph" (no param) in the Graph Editor and Graph Console.
We needed a thread-safe (synchronized) "getNextGraphId" routine for G* to use internally in order to prevent race conditions.
We also needed to return the newly created graph id to the user.
Here's how it goes:
- start critical section (in Master)
- gid = get the next available graph ID
- end critical section
- make a new graph with with id gid.
- set active graph gid (this notifies the user too)
- We can handle queries returning columns with the same name but from different tables.
-
Fall 2014
-
We pondered: what should the G* studio GUI look like?
We developed a beta of the GUI based on looking at
R Studio for general inspiration,
Max Lapides' compiler
for syntax-highlighting editing and GUI style,
operating systems from
Justin Svegliato
and
Chris Cordisco
for presentation techniques.
Greg and Thomas did a lot of work on it. - We invented an API. See the G* REST API Server home screen for details.
- How did we communicate between the browser and the G* API? Melissa and Cassie worked out APIrest based on NanoHTTPD. It's cool.
-
We pondered: what should the G* studio GUI look like?
We developed a beta of the GUI based on looking at
R Studio for general inspiration,
Max Lapides' compiler
for syntax-highlighting editing and GUI style,
operating systems from
Justin Svegliato
and
Chris Cordisco
for presentation techniques.
Sample Graphs
- Sample Graphs
-
Evolution: 4 Incremental Graphs
create graph 10.0
add vertex 1 with attributes (color=black)
add vertex 2 with attributes (color=black)
add vertex 3 with attributes (color=black)
add edge 1-2
add edge 2-3

clone graph 11.0 from 10.0"
add vertex a with attributes (color=white)
add vertex b with attributes (color=white)
add vertex c with attributes (color=white)
add edge 1-a
add edge 1-b
add edge 1-c

clone graph 12.0 from 11.0"
add vertex d with attributes (color=white)
add vertex e with attributes (color=white)
add vertex f with attributes (color=white)
add edge 2-d
add edge 2-e
add edge 2-f

clone graph 13.0 from 12.0"
add vertex g with attributes (color=white)
add vertex h with attributes (color=white)
add vertex i with attributes (color=white)
add edge 3-g
add edge 3-h
add edge 3-i
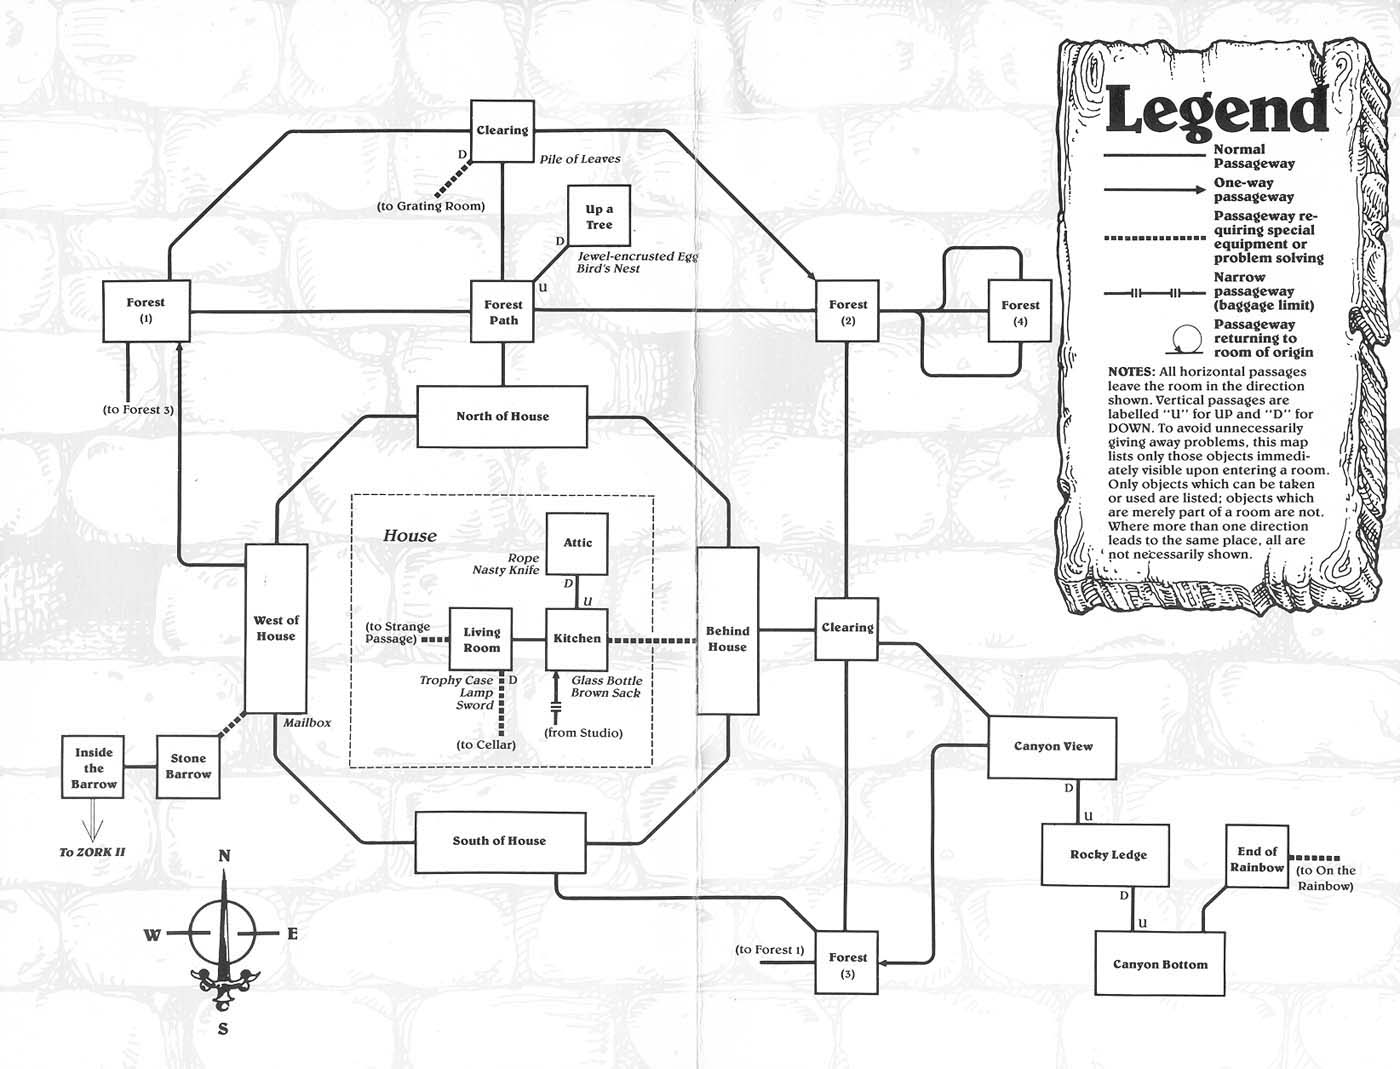
Zork I - above groundcreate graph 0 set active graph 0 create vertex 0 create vertex 1 create vertex 2 create vertex 3 create vertex 4 create vertex 5 create vertex 6 create vertex 7 create vertex 8 create vertex 9 create vertex 10 create vertex 11 create vertex 12 create vertex 13 create vertex 14 create vertex 15 create vertex 16 create vertex 17 create vertex 18 create vertex 19 create vertex 20 create edge 0-1 create edge 0-3 create edge 0-13 create edge 1-2 create edge 1-14 create edge 2-3 create edge 2-7 create edge 3-12 create edge 4-5 create edge 4-6 create edge 7-8 create edge 7-12 create edge 7-17 create edge 8-12 create edge 8-9 create edge 9-11 create edge 10-11 create edge 12-13 create edge 13-14 create edge 13-15 create edge 14-15 create edge 14-16 create edge 15-17 create edge 17-18 create edge 19-20
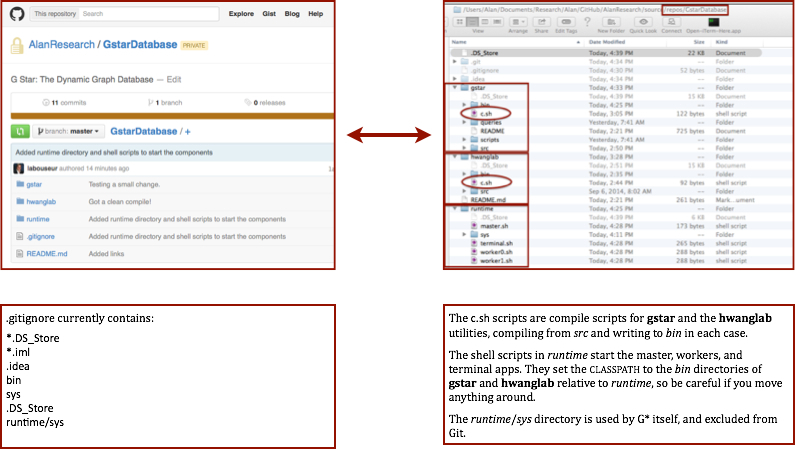